
Climate Data Visualization and Analysis
Climate Data Visualization and Analysis

Curriculum Module
Created with R2021b. Compatible with R2021b and later releases.
Description
Learn the basics of how to import, visualize, and analyze climate data using MATLAB® live scripts in this introductory module. In the first script, you will import temperature anomaly time-series data from the Global Historical Climatology Network (GHCN) [1] and atmospheric carbon dioxide data from the Global Monitoring Laboratory (GML) [3]. These data chronicle climate change on a global scale. Afterward, you will analyze changes to Arctic sea ice using data from the National Snow and Ice Data Center (NSIDC) [5]. The final two scripts explore Landsat 8 multispectral imaging data from the United States Geological Survey (USGS) [6]. You will use this data to characterize drought in Northern California. This module follows a use-modify-create learning progression. Early on, you will use existing code and modify it to analyze different data sets. As you advance further into the module, you will apply what you learned to write your own MATLAB code to analyze climate data.
Get started with the module by downloading and unzipping the repository. Then, double-click the project .prj file inside MATLAB. From there, you can follow the landing page instructions to get started with the examples and labs.
This module assumes that you already have a basic understanding of MATLAB. If you do not, consider completing MATLAB Onramp before starting this module.
The solutions are available upon instructor request. If you would like to request solutions or have a question, contact the MathWorks online teaching team.
Details
| Section | Learning Goals |
|---|---|
1. Global Temperature  
|
|
2. Arctic Sea Ice 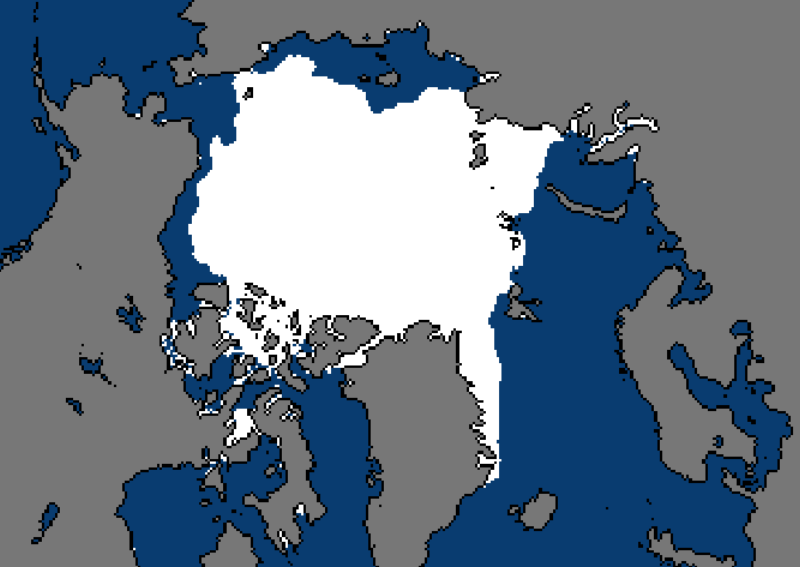
|
|
3. Multispectral Imaging 
|
|
4. Multispectral Indices 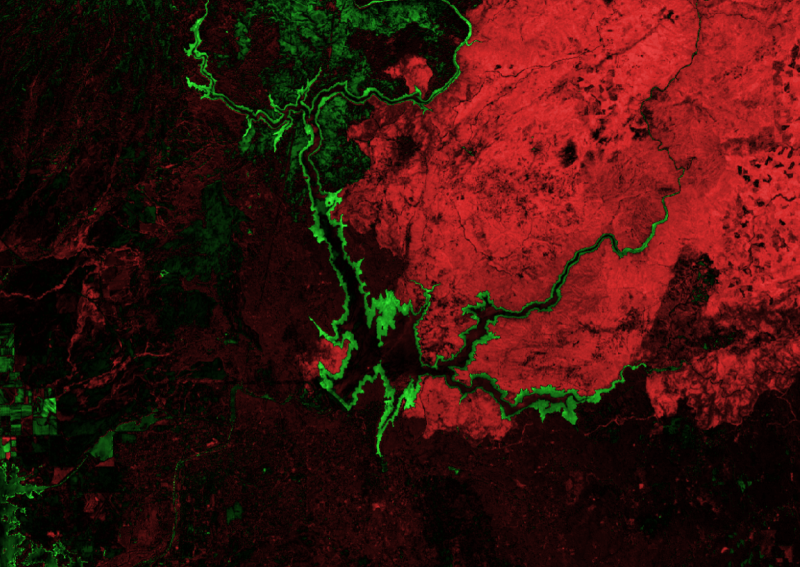
|
|
Suggested Prework
MATLAB Onramp – a free two-hour introductory tutorial that teaches the essentials of MATLAB.
Products
MATLAB, Image Processing Toolbox™, Statistics and Machine Learning Toolbox™, Curve Fitting Toolbox™
License
The license for this module is available in the LICENSE.md file in this GitHub repository.
Educator Resources
Data Sources
[1] Jay H. Lawrimore, Matthew J. Menne, Byron E. Gleason, Claude N. Williams, David B. Wuertz, Russell S. Vose, and Jared Rennie (2011): Global Historical Climatology Network - Monthly (GHCN-M), Version 3. NOAA National Centers for Environmental Information. doi:10.7289/V5X34VDR. Accessed 1 March, 2022.
[2] Freeman, E., Woodruff, S.D., Worley, S.J., Lubker, S.J., Kent, E.C., Angel, W.E., Berry, D.I., Brohan, P., Eastman, R., Gates, L. and Gloeden, W., 2017. ICOADS Release 3.0: a major update to the historical marine climate record. International Journal of Climatology, 37(5), pp.2211-2232.
[3] Data provided by Dr. Pieter Tans, NOAA/GML (gml.noaa.gov/ccgg/trends/) and Dr. Ralph Keeling, Scripps Institution of Oceanography (scrippsco2.ucsd.edu/). Mauna Loa CO2 annual mean data. NOAA Global Monitoring Laboratory. Accessed 2 March, 2022.
[4] Data provided by Ed Dlugokencky, NOAA/GML (gml.noaa.gov/ccgg/trends_ch4/). Global CH4 Monthly Means. NOAA Global Monitoring Laboratory. Accessed 2 March, 2022.
[5] Fetterer, F., K. Knowles, W. N. Meier, M. Savoie, and A. K. Windnagel. 2017, updated daily. Sea Ice Index, Version 3. Northern sea ice extent subset. Boulder, Colorado USA. NSIDC: National Snow and Ice Data Center. doi: https://doi.org/10.7265/N5K072F8. Accessed February 16, 2022.
[6] Landsat 8 Collection 1 Level-1, United States Geological Survey, Accessed March 9, 2022 at https://earthexplorer.usgs.gov/.
Copyright 2022 The MathWorks, Inc.
Cite As
Ryan Weinstein (2023). Climate Data Visualization and Analysis (https://github.com/MathWorks-Teaching-Resources/Climate-Data-Visualization-and-Analysis/releases/tag/v1.0.4), GitHub. Retrieved .
MATLAB Release Compatibility
Platform Compatibility
Windows macOS LinuxTags
Communities
Community Treasure Hunt
Find the treasures in MATLAB Central and discover how the community can help you!
Start Hunting!Discover Live Editor
Create scripts with code, output, and formatted text in a single executable document.
Navigation
Navigation
Scripts
| Version | Published | Release Notes | |
|---|---|---|---|
| 1.0.4.0 | See release notes for this release on GitHub: https://github.com/MathWorks-Teaching-Resources/Climate-Data-Visualization-and-Analysis/releases/tag/v1.0.4 |
||
| 1.0.3 | See release notes for this release on GitHub: https://github.com/MathWorks-Teaching-Resources/Climate-Data-Visualization-and-Analysis/releases/tag/v1.0.3 |
||
| 1.0.2 | See release notes for this release on GitHub: https://github.com/MathWorks-Teaching-Resources/Climate-Data-Visualization-and-Analysis/releases/tag/v1.0.2 |
||
| 1.0.1 | See release notes for this release on GitHub: https://github.com/MathWorks-Teaching-Resources/Climate-Data-Visualization-and-Analysis/releases/tag/v1.0.1 |
||
| 1.0.0 |
You can also select a web site from the following list
Americas
- América Latina (Español)
- Canada (English)
- United States (English)
Europe
- Belgium (English)
- Denmark (English)
- Deutschland (Deutsch)
- España (Español)
- Finland (English)
- France (Français)
- Ireland (English)
- Italia (Italiano)
- Luxembourg (English)
- Netherlands (English)
- Norway (English)
- Österreich (Deutsch)
- Portugal (English)
- Sweden (English)
- Switzerland
- United Kingdom (English)
Asia Pacific
- Australia (English)
- India (English)
- New Zealand (English)
- 中国
- 日本Japanese (日本語)
- 한국Korean (한국어)